Partial Interval vs Whole Interval Recording vs Momentary Time Sampling in ABA
Score partial interval, whole interval and momentary time sampling, see which overestimates or underestimates, with a worked example and 8 practice items.

By Praxis Notes Team Editorial team
Updated 22 min read
On this page
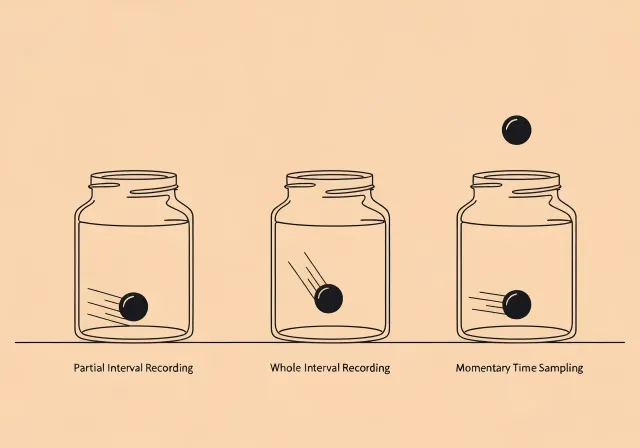
Partial interval recording scores an interval if the behavior occurs at any moment in it, so it tends to overestimate. Whole interval recording scores an interval only if the behavior lasts all of it, so it tends to underestimate. Momentary time sampling scores only the moment each interval ends, so it can err either way (Powell, Martindale & Kulp, 1975).
This page is for RBTs and BCBA trainees first, then BCBAs choosing a measurement system, and its original element is one fictional session scored all three ways against its true value. More explainers are in Behavior Analysis Concepts.
What are partial interval, whole interval and momentary time sampling?
Partial interval recording (PIR), whole interval recording (WIR) and momentary time sampling (MTS) are the three types of discontinuous measurement in ABA. Each divides an observation into equal intervals and scores each interval as an occurrence or not, by a different rule.
All three report data as the percentage of intervals in which the behavior was scored (Fiske & Delmolino, 2012). Praxis Learn has short glossary entries for partial interval recording, whole interval recording and momentary time sampling.
What is discontinuous measurement used for?
Discontinuous measurement samples the behavior during an observation instead of capturing every occurrence, and it is used when an observer cannot record every instance, for example when recording several behaviors at once (Fiske & Delmolino, 2012). It is easier to collect but produces more measurement error than continuous recording (LeBlanc et al., 2020); see continuous vs discontinuous ABA data.
Is partial or whole interval recording continuous or discontinuous?
Partial interval, whole interval and momentary time sampling are all discontinuous; the exact task wording is in the exam section.
Time sampling vs interval recording: are they different?
Time sampling and interval recording are overlapping names for the same family of methods; Powell and colleagues (1975) called all three “time sampling.” LeBlanc and colleagues (2020) use “interval recording” for methods that look at “some or all of each interval” and “time sampling” for MTS, which looks “at the exact time of observation” (LeBlanc et al., 2020). BCBA task C.6 names both interval recording and time sampling. On an exam, go by the scoring rule in the question, not the label.
What is partial interval recording and how do you score it?
In Fiske and Delmolino’s (2012) guidelines, “an occurrence is defined as an instance of target behavior that occurs at any time during the interval.”
How to score partial interval recording:
- Read the operational definition, including what counts as the start and end of an instance.
- Set the interval and observation length (10-second intervals for 5 minutes gives 30 intervals), number the intervals and start a timer that signals the end of each one.
- Watch the interval. The moment the behavior occurs, mark it scored (+); you can stop watching that interval (LeBlanc et al., 2016).
- If the behavior did not occur at any point, mark it not scored (−).
- Count the scored intervals and calculate the percentage.
The formula is the same for all three methods, the percentage of intervals:
Percentage of intervals = (scored intervals ÷ total intervals) × 100
Fictional example. In a 2-minute observation with 10-second intervals (12 intervals), Mia leaves her seat in intervals 2, 3, 7, 8 and 11. The marks for the 12 intervals:
− + + − − − + + − − + −
That is 5 ÷ 12 × 100 = 41.7% of intervals. It does not mean she left her seat 5 times or was out of it for 41.7% of the time.
Does partial interval recording overestimate or underestimate?
Partial interval recording overestimates how much of the time the behavior occurs. Powell and colleagues (1975) found that when the behavior “had to be exhibited only briefly within the observational interval (partial-interval time sampling), there was a consistent overestimate of the continuous measure.” The reason is that a 1-second response and a 9-second response in a 10-second interval are scored the same way (Fiske & Delmolino, 2012).
What does partial interval recording measure?
Partial interval recording measures the percentage of intervals in which the behavior occurred at least once, not how many times or how long. An earlier study found that PIR can underestimate the number of event occurrences, by approximately 35% (Repp et al., 1976, as cited by Wirth, Slaven & Taylor, 2014).
For which type of behavior is partial interval recording most appropriate?
When to use partial interval recording: it is most appropriate for brief, high-rate behavior you want to decrease, especially behavior that must reach zero.
- LeBlanc, Raetz, Sellers and Carr (2016, selection model) describe it as often used for high-rate behavior and for multiple forms of behavior.
- Fiske and Delmolino (2012) call it appropriate for behavioral excesses but strict, and say behavior that must be eliminated, such as eye gouging, could only be captured accurately with PIR.
- They advise against it for skills you want at high levels, such as on-task behavior: a child on task for only 3 seconds of each 10-second interval would be shown at 100% by PIR when the true value is 30% (Fiske & Delmolino, 2012).
What is whole interval recording and how do you score it?
In Fiske and Delmolino’s (2012) guidelines, whole interval recording counts an interval “when the target behavior occurs for the entire duration of the interval.”
How to score whole interval recording:
- Read the operational definition, including how long a pause has to be before the behavior counts as stopped.
- Set the interval and observation length and number the intervals.
- Watch each interval from its first second to its last.
- Mark it scored (+) only if the behavior occurred throughout; if it was absent at any point, even briefly, mark it not scored (−).
- Calculate the percentage: percentage of intervals = scored intervals ÷ total intervals × 100.
Fictional example. Jonah’s worksheet work is recorded with 10-second WIR for 1 minute (6 intervals). He works through intervals 1, 2, 4 and 6; in intervals 3 and 5 he looks at the window for about 2 seconds. The marks:
+ + − + − +
His result is 4 ÷ 6 × 100 = 66.7% of intervals, although he worked about 56 of the 60 seconds.
Does whole interval recording overestimate or underestimate?
Whole interval recording underestimates how much of the time the behavior occurs. It is the method that will underestimate behavior if the behavior stops briefly during the interval, because a pause of a second or two anywhere in the interval cancels the whole interval. Powell and colleagues (1975) found that when the behavior “had to be exhibited throughout the observational interval (whole-interval time sampling), there was a consistent underestimate of the continuous measure.” A 1-second response and a 9-second response in a 10-second interval are both scored as nonoccurrences (Fiske & Delmolino, 2012).
When should you use whole interval recording?
Use whole interval recording only for ongoing behavior you want sustained, such as engagement, when a strict standard is the point. Fiske and Delmolino call WIR overly stringent in many situations, and LeBlanc and colleagues (2016) do not recommend it for problem behavior, because it underestimates the level of the behavior. Jonah’s two 2-second glances cost two of six intervals, and if the definition does not say how long a pause counts as a stop, two observers may score them differently. Like the other interval methods, it suits behavior with no clear beginning or end, where separate occurrences cannot be counted; event recording is only appropriate for behaviors with clear beginnings and endings (LeBlanc et al., 2016).
What is momentary time sampling and how do you score it?
In Fiske and Delmolino’s (2012) guidelines, momentary time sampling counts an interval “only if the target behavior occurs as the interval ends, frequently in the last second of the interval.” What happens between those moments is not recorded.
How to score momentary time sampling:
- Read the operational definition.
- Set the interval length (for example, every 30 seconds) and the observation length.
- Between signals, do not record. Run the session as planned.
- At each signal, record whether the behavior is occurring at that moment (+) or not (−). Behavior that just stopped, or starts a second later, is a −.
- Calculate the percentage: percentage of intervals = scored intervals ÷ total intervals × 100.
Fictional example. Ava’s engagement with play materials is recorded with 30-second MTS for 5 minutes (10 checks). She is engaged at 7 checks. The marks, in the order the checks fell:
+ + − + + + − + + −
That is 7 ÷ 10 × 100 = 70% of intervals.
Does momentary time sampling overestimate or underestimate?
Momentary time sampling has no fixed direction of error overall (Powell et al., 1975; Wirth et al., 2014). Powell and colleagues found that with MTS “overestimations and underestimations of the continuous measure occurred about equally often.” In Wirth and colleagues’ simulation it read low when the behavior filled little of the session and high when it filled much of it, and its errors were largest with long intervals and short events. LeBlanc and colleagues (2016) list it as inappropriate for short-duration or low-frequency behavior.
When should you use momentary time sampling?
Use momentary time sampling for ongoing behavior, or when you are watching several learners or behaviors at once. It is the only one of the three that records the behavior only at the end of each interval; PIR and WIR require watching during the interval. That is why MTS suits multiple forms of behavior or the behavior of multiple individuals (LeBlanc et al., 2016). For on-task behavior and other behavior you want to increase, Fiske and Delmolino (2012) recommend MTS, which they describe as generally the most accurate of the three; WIR may be appropriate but is overly stringent in many situations.
Partial vs whole interval recording vs MTS: which over- or underestimates?
Partial interval recording overestimates, whole interval recording underestimates, and momentary time sampling errs in both directions, usually by less (Wirth et al., 2014).
| Method | Scored when, error, and what you watch |
|---|---|
| Partial interval | Scored when the behavior occurs at any moment in the interval. Error: reads high. Watch: until the behavior first occurs in the interval. |
| Whole interval | Scored when the behavior lasts the entire interval. Error: reads low. Watch: the whole interval. |
| Momentary time sampling | Scored when the behavior is occurring as the interval ends. Error: no fixed direction overall; reads low when the behavior fills little of the session and high when it fills much of it (Wirth et al., 2014). Watch: only the moment the interval ends. |
Which discontinuous method gives the best estimate?
Momentary time sampling usually gives the closest estimate, unless the behavior is brief or rare: absolute error tends to be smaller with MTS than with PIR and WIR (Wirth et al., 2014), and across more than 800 sessions from everyday practice MTS outperformed interval recording (LeBlanc et al., 2020). Continuous recording beats all three.
Worked example: one session scored three ways
Fictional example. Theo, 7, hums and repeats phrases from videos during independent work. His plan defines vocal stereotypy as humming, repeated sounds or scripted phrases not directed at anyone and audible from 1 meter; a bout ends when 2 seconds pass without a sound. A BCBA timed every bout from a video of one 5-minute (300-second) session:
- 0:03–0:06 (3 s), 0:14–0:41 (27 s), 0:52–0:54 (2 s)
- 1:17–1:21 (4 s), 1:36–2:17 (41 s), 2:38–2:41 (3 s)
- 3:03–3:06 (3 s), 3:32–3:58 (26 s), 4:38–4:41 (3 s)
That is 9 bouts and 112 seconds: 112 ÷ 300 × 100 = 37.3% of the session, the true value from continuous duration recording. Six short bouts (2 to 4 seconds) total 18 seconds; three long ones total 94.
The first minute, interval by interval
Scored with 10-second intervals; the MTS check is the moment each interval ends.
- 0:00–0:10 (humming 3 s): PIR +, WIR −, MTS − (quiet at 0:10)
- 0:10–0:20 (humming 6 s, from 0:14): PIR +, WIR −, MTS + (humming at 0:20)
- 0:20–0:30 (humming all 10 s): PIR +, WIR +, MTS +
- 0:30–0:40 (humming all 10 s): PIR +, WIR +, MTS +
- 0:40–0:50 (humming 1 s, until 0:41): PIR +, WIR −, MTS −
- 0:50–1:00 (humming 2 s): PIR +, WIR −, MTS −
In the first minute Theo hummed 32 of 60 seconds (53.3%). PIR scored 6 of 6 intervals (100%), WIR 2 of 6 (33.3%) and MTS 3 of 6 (50%).
The whole session at 10-second and 30-second intervals
| Method and interval length | Estimate and error against the true 37.3% |
|---|---|
| Partial interval, 10-s | 21 of 30 = 70.0% of intervals; 32.7 points too high |
| Partial interval, 30-s | 9 of 10 = 90.0% of intervals; 52.7 points too high |
| Whole interval, 10-s | 6 of 30 = 20.0% of intervals; 17.3 points too low |
| Whole interval, 30-s | 0 of 10 = 0.0% of intervals; 37.3 points too low |
| Momentary time sampling, 10-s | 12 of 30 = 40.0% of intervals; 2.7 points too high |
| Momentary time sampling, 30-s | 2 of 10 = 20.0% of intervals; 17.3 points too low |
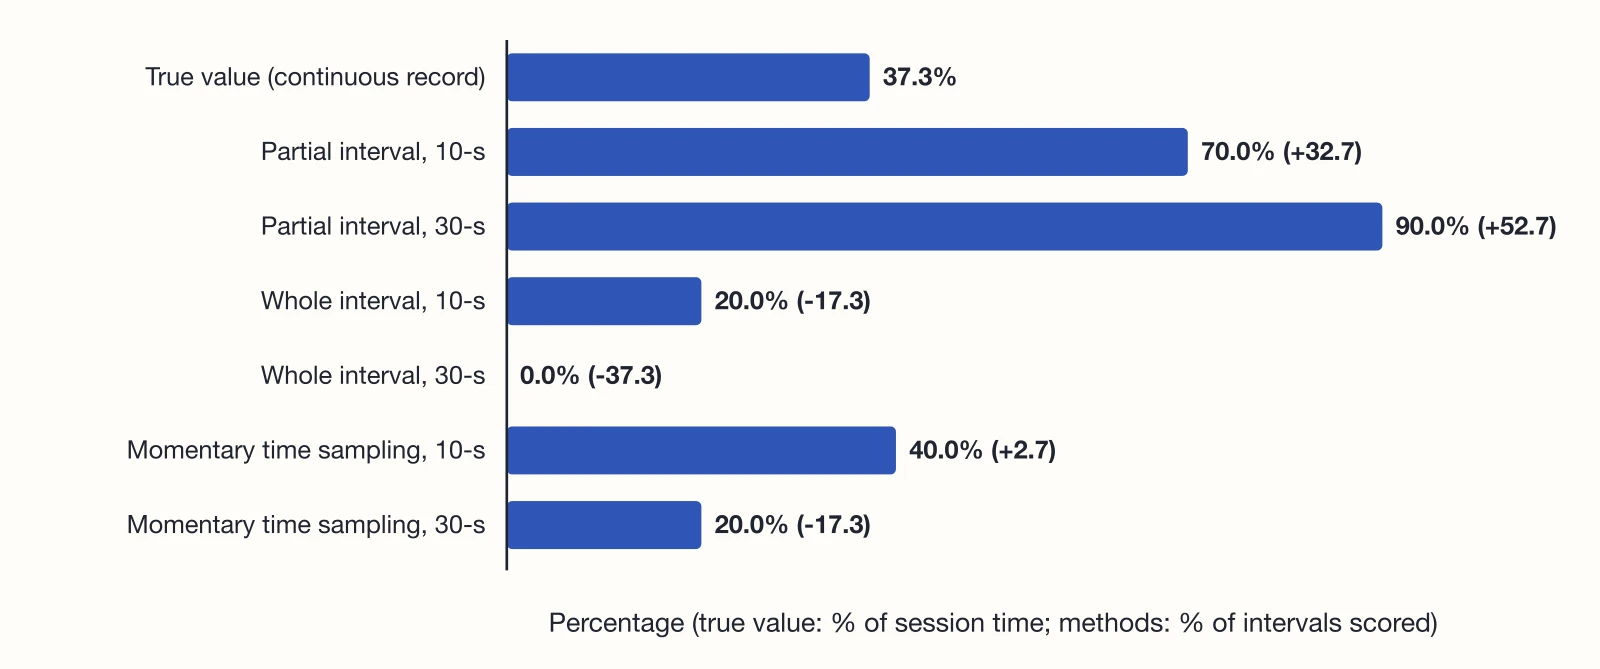
What to read from it:
- Brief bouts inflate PIR. The six short bouts, 18 seconds in all, produced 9 of the 21 intervals PIR scored at 10 seconds, because three of the six (1:17–1:21, 2:38–2:41 and 4:38–4:41) straddle a 10-second boundary and score two intervals each. At 30 seconds, all but one interval was scored.
- A long bout can miss every whole interval. The 41-second bout (1:36–2:17) did not cover either full 30-second interval it touched (1:30–2:00, 2:00–2:30), so WIR at 30 seconds scored nothing.
- MTS errs both ways, more with longer intervals. It was 2.7 points high at 10 seconds and 17.3 points low at 30 seconds, where the checks at 3:30 and 4:00 missed the whole 26-second bout at 3:32–3:58.
One session shows how each method works, not how large its error is in general; the studies above give the general pattern.
What happens when intervals are too long?
When intervals are long compared with each instance of the behavior, every method gets less accurate: partial interval recording climbs toward 100%, whole interval recording falls toward 0%, and momentary time sampling misses more short events. That error comes from the method, not the learner: it is measurement bias, also called a measurement artifact.
What the research says about interval length:
- Compare the interval with the event. Error is small when the interval is shorter than or close to the event duration and grows when the interval exceeds it, so any rule of thumb based on one factor alone will be misleading (Wirth et al., 2014).
- Shorter is more accurate, within limits. Briefer intervals introduce less systematic error, but the shortest add observer error: in a study Fiske and Delmolino (2012) describe, agreement on MTS fell to unacceptable levels with intervals under 3 seconds, and in most cases 10-second PIR intervals still overestimate.
- Practice uses long intervals. The most commonly used intervals in LeBlanc and colleagues’ (2020) practice database were 2 to 5 minutes, and intervals of 3 minutes or less corresponded best with continuous data.
In our reading, check the length of a typical bout: if the behavior lasts about 2 seconds, a 30-second PIR interval is scored whenever it occurs once, and a reduction will not show until the behavior nearly stops.
Which method should you use?
Use continuous recording when you can, partial interval recording for brief behavior that must stop, momentary time sampling for ongoing behavior or several learners, and whole interval recording only when a strict standard for sustained behavior is the point. LeBlanc and colleagues (2016) set out a decision model; the table sums up where the sources agree.
| Behavior and goal | Method to consider and why |
|---|---|
| Clear start and end, and an observer free to watch | Continuous (frequency, rate, duration): no systematic error (Fiske & Delmolino, 2012) |
| Brief, high-rate behavior to decrease, or one that must stop | Partial interval recording, knowing it needs near elimination to show a large change (Fiske & Delmolino, 2012; LeBlanc et al., 2016) |
| Ongoing behavior to increase, such as on-task behavior | Momentary time sampling, which Fiske and Delmolino (2012) recommend for behavior to increase; whole interval recording is appropriate but overly stringent |
| Ongoing behavior to decrease, such as stereotypy | Momentary time sampling: “much smaller errors than PIR” (Gardenier, MacDonald & Green, 2004); closer to duration-based conclusions (Meany-Daboul et al., 2007) |
| Several learners or behaviors at once | Momentary time sampling (LeBlanc et al., 2016) |
| Short or rare behavior | Not MTS (LeBlanc et al., 2016); count every occurrence instead |
| Problem behavior | Not whole interval recording, which can show a treatment effect while the behavior persists (Fiske & Delmolino, 2012; LeBlanc et al., 2016) |
The supervising BCBA chooses the system; the RBT runs it as written and reports when it does not fit. The Praxis Learn lesson on selecting a measurement procedure covers the BCBA side.
Use continuous recording (frequency, rate, duration, latency) whenever the behavior has a clear start and end and someone can record every instance; LeBlanc and colleagues (2016) strongly prefer continuous procedures because they eliminate the error of discontinuous ones. See continuous vs discontinuous ABA data and the BCBA lesson on continuous vs discontinuous measurement.
How do you report, graph and check interval data?
PIR data are reported as a percentage of intervals, and so are WIR and MTS data (Fiske & Delmolino, 2012). Graph them that way, with the method and interval length, never as a count or a duration: “21 of 30 intervals” means the scoring rule was met in 21 intervals, not 21 instances or 70% of the time.
- Write it out in full: “Vocal stereotypy: 40% of 10-s intervals (MTS), 5-minute observation.” Without the method and interval length, nobody can tell whether 40% is likely high or low. Do not convert a percentage of intervals into minutes or a rate; if you need a count or a duration, record one (see rate vs percentage of occurrence).
- Label the y-axis “Percentage of 10-s intervals with vocal stereotypy,” not “minutes” or “times.” For reading the graph, see level, trend and variability.
- Keep the method and interval length constant across a data path. In the worked example the same session reads anywhere from 0% to 90%. The error is not consistent across conditions: even with the same method, it can change between phases if the length of each bout changes (Powell et al., 1975). If the system changes, draw a phase change line.
How do you check interval data?
Check interval data for reliability with interobserver agreement (IOA) and, in our reading, for accuracy against an occasional continuous record. Two observers can both score 12 of 30 intervals and disagree about which 12, so comparing totals hides disagreement; interval-based IOA compares each interval’s mark. Our guide to IOA formulas for interval data covers interval-by-interval, scored-interval and unscored-interval IOA. Agreement shows that observers applied the rule the same way, not that it is accurate; for that, score a video both continuously and with your interval system, as in the worked example.
How does discontinuous measurement show up on the RBT and BCBA exams?
On the RBT exam, discontinuous measurement is task A.2 of the RBT Test Content Outline (3rd ed.), in Domain A, Data Collection and Graphing (13 of 75 scored questions). On the BCBA exam it falls under tasks C.5, C.6, C.8 and C.9 of the BCBA Test Content Outline (6th ed.), in Domain C, Measurement, Data Display, and Interpretation (21 of 175 scored questions).
| Outline (BACB, updated 09/2024) | Task and exact wording |
|---|---|
| RBT Test Content Outline (3rd ed.), RBT exams from 2026 | A.2: “Implement discontinuous measurement procedures (e.g., partial & whole interval, momentary time sampling).” |
| RBT Test Content Outline (3rd ed.) | A.6: “Calculate and summarize data in different ways (e.g., rate, mean duration, percentage).” |
| BCBA Test Content Outline (6th ed.), BCBA exams from 2025 | C.5: “Distinguish between continuous and discontinuous measurement procedures.” C.6: “Design and apply discontinuous measurement procedures (e.g., interval recording, time sampling).” |
| BCBA Test Content Outline (6th ed.) | C.8: “Evaluate the validity and reliability of measurement procedures.” C.9: “Select a measurement procedure to obtain representative data that accounts for the critical dimension of the behavior and environmental constraints.” |
Older study guides call the RBT task A-3, its code in the RBT Task List (2nd ed.), which the 3rd-ed. outline replaced for exams from 2026. In the 3rd edition, A.3 is “Implement permanent product recording procedures.”
The Praxis Learn RBT A.2 study guide on discontinuous measurement and the BCBA lesson on designing discontinuous measurement (C.6) cover the tasks.
Practice questions on partial interval, whole interval and MTS
Every scenario is fictional. Decide before you open the answer.
1. A.2: The gap between the data sheet and the video
Kai’s hand flapping is recorded with 15-second partial interval recording. When his BCBA times the same session from video, hand flapping filled about 10% of the session, but the data sheet shows 55% of intervals. What best explains the gap?
- A. The RBT must have scored the intervals incorrectly
- B. Partial interval recording scores a whole interval for any brief occurrence, so it runs above the true proportion of time
- C. Partial interval recording underestimates, so the video must be wrong
- D. The data sheet shows that Kai flapped his hands 55 times, which the video timing missed
Answer and rationale
B. Each brief flap earns a full scored interval, so PIR overestimates the proportion of time. A is tempting, but correct PIR scoring produces exactly this kind of gap. C has the direction backwards. D reads a percentage of intervals as a count: 55% means 55% of the intervals were scored, not 55 flaps. Task A.2.
2. A.2: Short pauses
Zoe builds a puzzle for most of each 20-second interval but stops for about 2 seconds in almost every interval to look at the door, then goes back to it. Which method will show the lowest level of puzzle work?
- A. Partial interval recording
- B. Momentary time sampling
- C. Whole interval recording
- D. Continuous duration recording
Answer and rationale
C. Whole interval recording needs the behavior through the entire interval, so each 2-second glance cancels an interval. A would score almost every interval, since she works at some point in each. B would usually find her working at the check, since she works about 90% of the time. D would find the true value, about 90% here (about 18 of every 20 seconds), which is not the lowest level. Task A.2.
3. A.2: Looking only at the signal
An RBT is running a group. Her plan says: each time the vibrating timer goes off (every 60 seconds), look at Ian and record whether he is holding the class materials at that moment. What he does between signals is not recorded. Which method is this?
- A. Partial interval recording
- B. Whole interval recording
- C. Continuous duration recording
- D. Momentary time sampling
Answer and rationale
D. Recording only whether the behavior is happening as each interval ends is momentary time sampling. A and B both score what happens across an interval, not only the moment it ends. C would time every second Ian holds the materials. Task A.2.
4. C.6: Long intervals for brief behavior
A BCBA is setting up partial interval recording for vocal outbursts that last 1 to 2 seconds and happen a few times per minute. The teacher who will collect the data asks for 5-minute intervals to save effort. What will the data most likely show?
- A. Nearly every interval scored, a level near 100% that will barely move until the outbursts almost stop
- B. A level close to the true value, because a longer interval samples more behavior
- C. A level well below the true value, because brief outbursts are missed in long intervals
- D. No change in accuracy, since interval length matters only for momentary time sampling
Answer and rationale
A. When intervals are far longer than the events, one brief outburst scores 5 minutes, so PIR approaches 100% and cannot show a reduction until the behavior nearly stops (Wirth et al., 2014). B confuses a longer interval with a longer observation. C describes MTS or whole interval recording; PIR scores every occurrence the observer sees. D is wrong because interval length affects all three methods. Task C.6.
5. C.9: Choosing a method for on-task behavior
Leo’s goal is to work independently for longer during a 20-minute work period. His RBT is also running programs for two other learners, so timing every second is not possible. Which measurement system fits best?
- A. 10-second partial interval recording
- B. A frequency count of how many times Leo starts working
- C. Whole interval recording with 5-minute intervals
- D. Momentary time sampling with short intervals
Answer and rationale
D. MTS lets the RBT look up only at each signal, and Fiske and Delmolino (2012) recommend it for behavior you want to increase. A is the classic trap: PIR scores any brief moment of work, so it overstates progress. C is so strict that one glance away loses 5 minutes. B counts starts, not how long he works. Task C.9.
6. A.6: Reading the result
A data sheet says: “Aggression, 10-s partial interval, 30-minute observation: 18% of intervals.” Which statement is accurate?
- A. Aggression occurred 18 times
- B. Aggression lasted 18% of the session, about 5 minutes and 24 seconds
- C. At least one act of aggression occurred in 18% of the 10-second intervals; the count and duration cannot be read from this
- D. Aggression occurred in 18 of the 180 intervals
Answer and rationale
C. PIR reports the percentage of intervals with at least one occurrence. A treats it as a count, although one interval can hold several acts. B treats it as a duration, which PIR overestimates. D gets the arithmetic wrong: 18% of 180 ten-second intervals is about 32. Task A.6 (with A.2).
7. A.6: Calculating the error
In the worked example above, momentary time sampling at 30-second intervals found Theo humming at 2 of 10 checks. The continuous record shows 112 seconds of humming in the 300-second session. What are the MTS estimate and its error?
- A. 20% of intervals, 17.3 percentage points below the true 37.3%
- B. 20% of intervals, 17.3 percentage points above the true 37.3%
- C. 37.3%, with no error, because MTS is unbiased
- D. 0.7%, because 2 ÷ 300 × 100 = 0.7
Answer and rationale
A. The estimate is 2 ÷ 10 × 100 = 20% of intervals; the true value is 112 ÷ 300 × 100 = 37.3%, so MTS was 17.3 points too low. B gets the direction wrong. C repeats a common error: MTS has no single direction of error, but it still errs. D divides by seconds instead of intervals. Task A.6 (with A.2).
8. C.9: A brief, rare behavior
Ruby has short tantrums, a few a day, each under a minute. A BCBA proposes 2-minute momentary time sampling across a 2-hour session to track them. What is the main problem?
- A. MTS will overestimate, because any tantrum in an interval is scored
- B. Brief, rare episodes will often fall between checks, so MTS will tend to read low or show zero
- C. There is no problem, because MTS has no systematic error
- D. MTS needs intervals shorter than 10 seconds to count anything
Answer and rationale
B. LeBlanc et al. (2016) list MTS as inappropriate for short-duration or low-frequency behavior, and MTS tends to underestimate behavior that fills little of the session (Wirth et al., 2014); a continuous count of tantrums with their durations fits better. A describes PIR. C ignores the direction of MTS error at low levels. D is not a rule of the method: MTS records whatever is happening at each check, whatever the interval length, and the problem here is that long intervals miss brief events. Task C.9.
For more items on Domain A, try the RBT Data Collection and Graphing practice exam; BCBA candidates can use the Measurement, Data Display and Interpretation practice exam.
Sources
- Behavior Analyst Certification Board. RBT Test Content Outline (3rd ed.). Updated 09/2024. Tasks A.2, A.3, A.6.
- Behavior Analyst Certification Board. RBT Task List (2nd ed.). Version 08/2024. Task A-3.
- Behavior Analyst Certification Board. BCBA Test Content Outline (6th ed.). Updated 09/2024. Tasks C.5, C.6, C.8, C.9.
- Powell, J., Martindale, A., & Kulp, S. (1975). An evaluation of time-sample measures of behavior. Journal of Applied Behavior Analysis, 8(4), 463–469. doi:10.1901/jaba.1975.8-463
- Gardenier, N. C., MacDonald, R., & Green, G. (2004). Comparison of direct observational methods for measuring stereotypic behavior in children with autism spectrum disorders. Research in Developmental Disabilities, 25(2), 99–118. doi:10.1016/j.ridd.2003.05.004 (abstract)
- Meany-Daboul, M. G., Roscoe, E. M., Bourret, J. C., & Ahearn, W. H. (2007). A comparison of momentary time sampling and partial-interval recording for evaluating functional relations. Journal of Applied Behavior Analysis, 40(3), 501–514. doi:10.1901/jaba.2007.40-501
- Fiske, K., & Delmolino, L. (2012). Use of discontinuous methods of data collection in behavioral intervention: Guidelines for practitioners. Behavior Analysis in Practice, 5(2), 77–81. doi:10.1007/BF03391826
- Wirth, O., Slaven, J., & Taylor, M. A. (2014). Interval sampling methods and measurement error: A computer simulation. Journal of Applied Behavior Analysis, 47(1), 83–100. doi:10.1002/jaba.93
- LeBlanc, L. A., Raetz, P. B., Sellers, T. P., & Carr, J. E. (2016). A proposed model for selecting measurement procedures for the assessment and treatment of problem behavior. Behavior Analysis in Practice, 9(1), 77–83. doi:10.1007/s40617-015-0063-2
- LeBlanc, L. A., Lund, C., Kooken, C., Lund, J. B., & Fisher, W. W. (2020). Procedures and accuracy of discontinuous measurement of problem behavior in common practice of applied behavior analysis. Behavior Analysis in Practice, 13(2), 411–420. doi:10.1007/s40617-019-00361-6
All examples on this page are fictional. Sources last checked on October 28, 2026.
Updated October 28, 2026: rewritten with scoring steps for each method, a worked example, a graph and practice questions, and merged with ten shorter pages on these methods. Corrected: MTS is no longer described as having minimal bias, and an IOA rule wrongly attributed to the RBT Handbook was removed.
Reviewed by the Praxis Notes team on October 28, 2026.