IOA Formulas in ABA: 9 Types of Interobserver Agreement, With Worked Examples
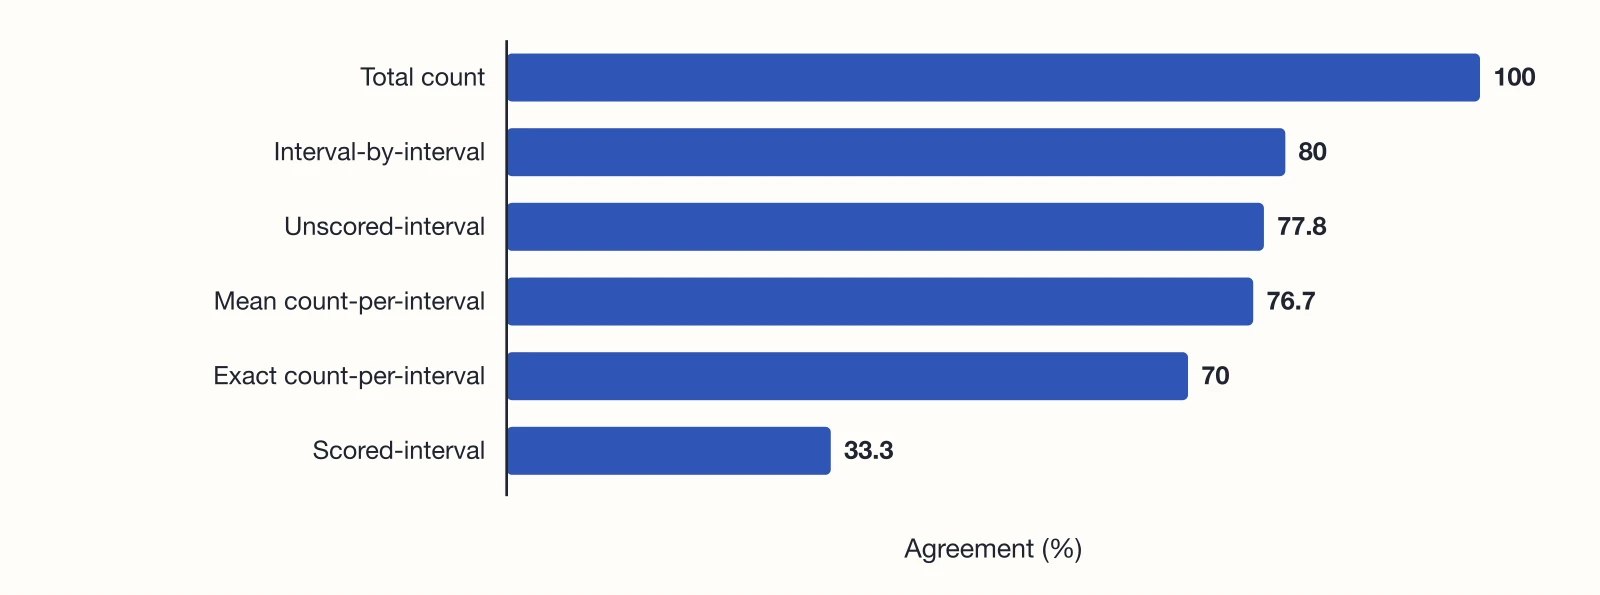
IOA formulas in ABA: 9 interobserver agreement types with the math shown. One fictional record scores 100% by total count but 33% by scored-interval.

By Praxis Notes Team Editorial team
Updated 17 min read
On this page
IOA, or interobserver agreement, is the percentage match between two observers’ records of the same session. Reed and Azulay (2011) describe nine standard formulas: total count, mean count-per-interval, exact count-per-interval, trial-by-trial, total duration, mean duration-per-occurrence, interval-by-interval, scored-interval and unscored-interval. Total count, the simplest, is smaller count ÷ larger count × 100.
This page is for RBT candidates, new RBTs and BCBA trainees. It scores one fictional session with six formulas, then adds a trial set and a timing set for the other three, with the arithmetic shown, so you can see the same record come out anywhere from 100% to 33.3%. More explainers are in Behavior Analysis Concepts.
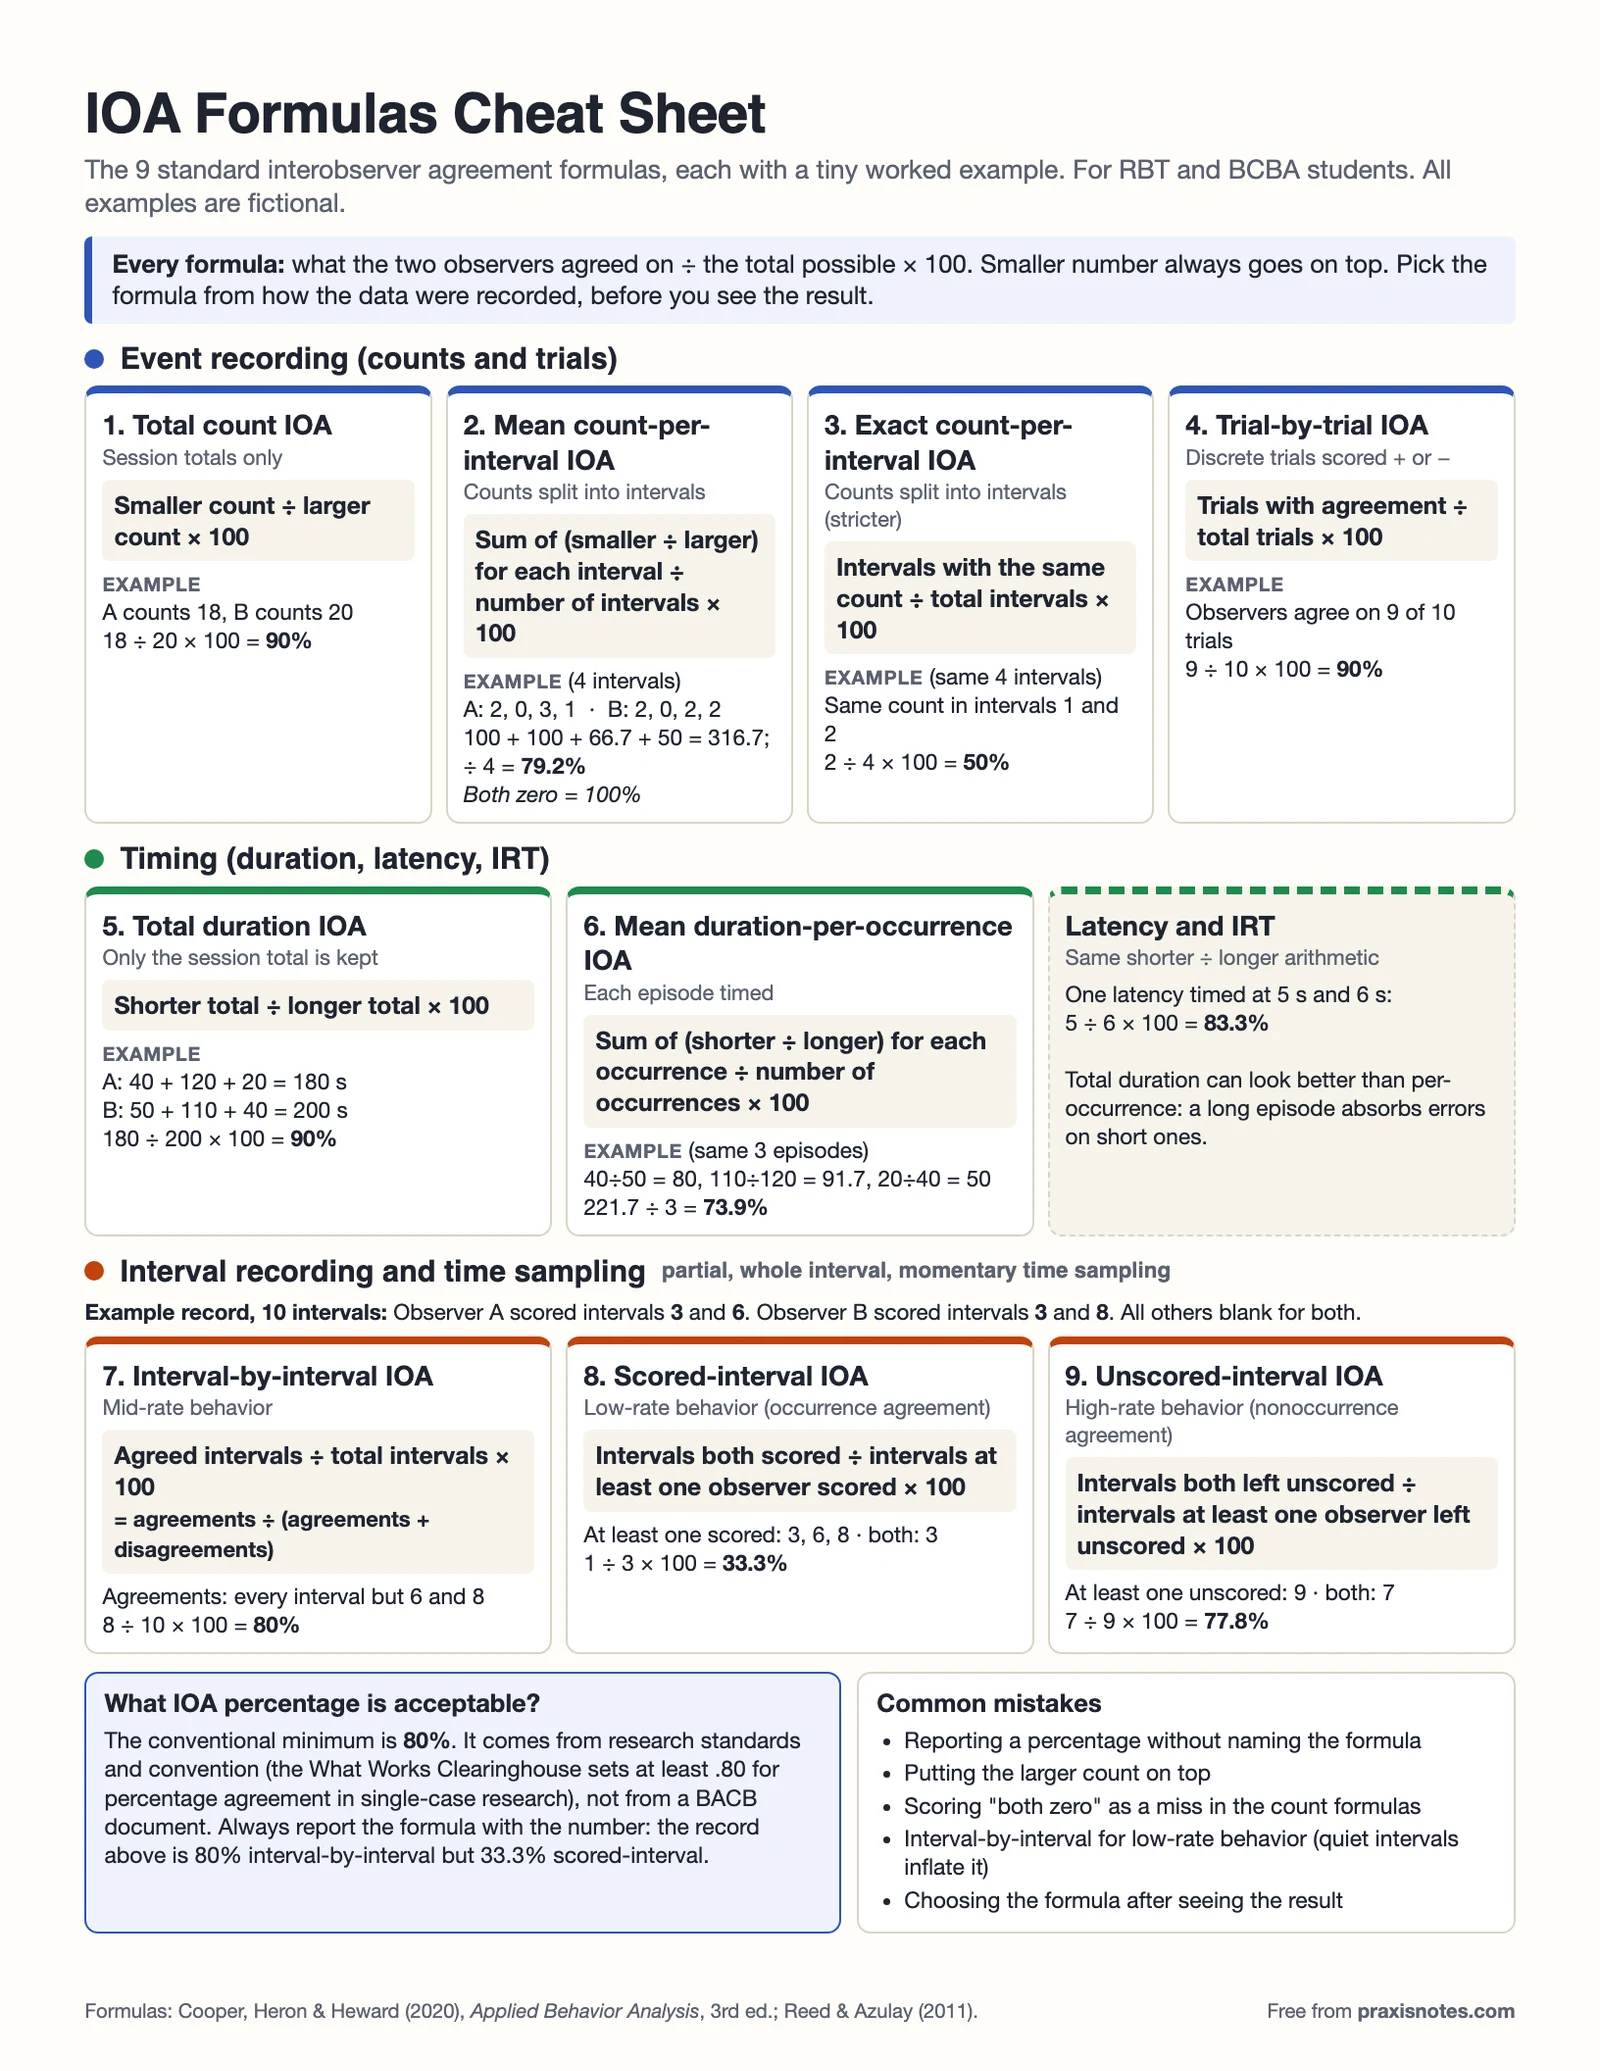
Free printable: download the IOA formulas cheat sheet (PDF), one page with all nine formulas, a worked example for each and the 80% convention.
Understanding Interobserver Agreement (IOA) in ABA
Johnston (2025) describes IOA as the calculated comparison of data from primary and secondary observers. IOA data are the records a second observer collects on the same session, plus the percentage that comes from comparing them with the primary observer’s record.
To collect IOA data, two trained observers use the same behavior definition and the same measurement system, watch the same session, and record without talking or checking each other’s sheets. For the setup, the data sheet and how to write it up, see how RBTs collect and record IOA.
What does a high IOA score indicate?
A high IOA score indicates that two observers are recording the behavior the same way. It does not prove the data are correct. As Vollmer, Sloman and St. Peter Pipkin (2008) put it, “two observers could be wrong about the same thing,” so reliability and accuracy are separate questions. If two RBTs watch one session and tally different numbers of events, their agreement is lower, and the formulas below show by how much. It says nothing about whether the plan was run correctly, which is what procedural integrity checks measure.
Why do supervisors conduct IOA checks?
Supervisors conduct IOA checks to confirm that behavior is being recorded consistently before anyone makes decisions from the data. Vollmer and colleagues (2008) give a hypothetical example: caregivers record less carefully after treatment starts, the data look better, and the team wrongly concludes the treatment worked. They call this a false positive. Repeated checks also help catch observer drift, when an observer’s scoring slowly moves away from the definition. Vollmer and colleagues say careful monitoring of observers, combined with periodic booster training, may help prevent it.
What are the types of IOA?
Reed and Azulay (2011) describe nine standard IOA formulas in three families, set by how the data were recorded: event, interval and duration. They are not the only measures. Cohen’s kappa (What Works Clearinghouse) and time-window analysis (Mudford and colleagues, 2009) are others, and Reed and Azulay note that numerous formulae exist. The last column shows each result on the fictional session worked below.
| Type of IOA | Use it with | Formula | Our session |
|---|---|---|---|
| Total count | Event counts | Smaller count ÷ larger count × 100 | 100% |
| Mean count-per-interval | Event counts split into intervals | Mean of (smaller ÷ larger) for each interval × 100 | 76.7% |
| Exact count-per-interval | Event counts split into intervals | Intervals with the same count ÷ total intervals × 100 | 70% |
| Trial-by-trial | Discrete trials | Trials with agreement ÷ total trials × 100 | 80% |
| Total duration | Timed behavior | Shorter total ÷ longer total × 100 | 90% |
| Mean duration-per-occurrence | Timed behavior | Mean of (shorter ÷ longer) for each occurrence × 100 | 73.9% |
| Interval-by-interval | Interval recording, time sampling | Agreed intervals ÷ total intervals × 100 | 80% |
| Scored-interval | Interval data, low-rate behavior | Both scored ÷ intervals at least one observer scored × 100 | 33.3% |
| Unscored-interval | Interval data, high-rate behavior | Both unscored ÷ intervals at least one observer left unscored × 100 | 77.8% |
The names vary between sources, so go by the calculation. Reed and Azulay call mean count-per-interval “partial agreement-within-intervals” or “block-by-block,” call exact count-per-interval “exact agreement,” and call scored-interval and unscored-interval “occurrence” and “nonoccurrence” agreement. Study materials also use “point-by-point” for trial-by-trial and interval-by-interval alike, so a search for point-by-point IOA can mean either.
How do you calculate IOA?
You calculate IOA by dividing the amount the two observers agreed on by the total possible, then multiplying by 100.
- Get both records of the same session.
- Pick the formula that matches how the data were recorded.
- Work out the agreement and the total that formula uses.
- Divide, then multiply by 100.
You don’t need an IOA calculator. In a spreadsheet with the two counts in B2 and C2, this returns the smaller-over-larger percentage and treats two zeros as full agreement: =IF(MAX(B2,C2)=0,100,MIN(B2,C2)/MAX(B2,C2)*100). The interval formulas count matching rows rather than comparing two totals, so only the count formula is shown here. Reed and Azulay (2011) also describe an Excel-based tool for the full set.
One fictional session, scored six ways
Fictional example. An RBT (Observer A) and a supervisor (Observer B) independently watch a 10-minute session and tally calling out in each 1-minute interval. Any interval with a count above zero counts as scored for the interval formulas.
| Minute | Observer A count | Observer B count | Smaller ÷ larger | Same count? | Scored by |
|---|---|---|---|---|---|
| 1 | 0 | 0 | Both zero: 100% | Yes | Neither |
| 2 | 0 | 0 | Both zero: 100% | Yes | Neither |
| 3 | 3 | 2 | 2 ÷ 3 = 66.7% | No | Both |
| 4 | 0 | 0 | Both zero: 100% | Yes | Neither |
| 5 | 0 | 0 | Both zero: 100% | Yes | Neither |
| 6 | 1 | 0 | 0 ÷ 1 = 0% | No | A only |
| 7 | 0 | 0 | Both zero: 100% | Yes | Neither |
| 8 | 0 | 2 | 0 ÷ 2 = 0% | No | B only |
| 9 | 0 | 0 | Both zero: 100% | Yes | Neither |
| 10 | 0 | 0 | Both zero: 100% | Yes | Neither |
| Total | 4 | 4 | 7 of 10 |
Keep this table open. The next sections use it.
What is the formula for total count IOA?
The total count IOA formula is smaller count ÷ larger count × 100.
- On our session: 4 ÷ 4 × 100 = 100%.
That 100% is the trap. Both observers scored only one of the three minutes with calling out (minute 3), and each scored a minute the other did not. Reed and Azulay (2011) make the same point: two observers can record entirely different responses and still reach 100%, and they call total count “not a very stringent agreement procedure.” In our reading, this is why point-by-point (interval-by-interval) IOA is the stricter check when you have interval data: it looks at whether the observers scored the same moments, not only the same total.
How do you calculate mean count-per-interval IOA?
To calculate mean count-per-interval IOA, work out smaller ÷ larger for each interval, then take the mean. An interval where both observers recorded zero scores 100%, and one where only one observer recorded anything scores 0%, as in the worked example from Reed and Azulay (2011).
- Each interval: seven intervals at 100%, one at 66.7% and two at 0%.
- Sum: (7 × 100) + 66.7 + 0 + 0 = 766.7.
- Mean: 766.7 ÷ 10 = 76.7%.
How do you calculate exact count-per-interval IOA?
Exact count-per-interval IOA is the number of intervals where both observers recorded the same count ÷ total intervals × 100. Close does not count, so 3 and 2 is a miss.
- On our session: 7 ÷ 10 × 100 = 70%.
Exact count-per-interval is the stricter of the two count-per-interval formulas, and Reed and Azulay (2011) call it “the most conservative approach to IOA.” It has a blind spot at low rates: all 7 matches in our session are intervals where nothing happened, and the observers had the same count in none of the 3 intervals with any calling out. Mudford and colleagues (2009) found exact agreement and block-by-block algorithms were open to inflated estimates at lower rates and durations, and exact agreement looked overly stringent at higher rates.
How do interval-by-interval, scored and unscored IOA differ?
Interval-by-interval, scored-interval and unscored-interval IOA read the same yes-or-no record and differ in which intervals they count. Interval-by-interval counts all of them, scored-interval counts those at least one observer scored, and unscored-interval counts those at least one observer left blank. These formulas work for partial interval, whole interval and momentary time sampling.
Interval-by-interval IOA formula
Interval-by-interval IOA is agreed intervals ÷ total intervals × 100, where an agreement is both observers scoring or both leaving the interval blank.
- Agreed: minutes 1, 2, 3, 4, 5, 7, 9 and 10, which is 8 intervals. They disagree on minutes 6 and 8.
- Result: 8 ÷ 10 × 100 = 80%.
Scored-interval IOA formula
Scored-interval IOA is intervals both observers scored ÷ intervals at least one observer scored × 100.
- At least one scored: minutes 3, 6 and 8, which is 3 intervals.
- Both scored: minute 3 only.
- Result: 1 ÷ 3 × 100 = 33.3%.
Unscored-interval IOA formula
Unscored-interval IOA is intervals both observers left unscored ÷ intervals at least one observer left unscored × 100.
- At least one left unscored: every minute except minute 3, which is 9 intervals.
- Both left unscored: minutes 1, 2, 4, 5, 7, 9 and 10, which is 7 intervals.
- Result: 7 ÷ 9 × 100 = 77.8%.
Why does the same record give such different numbers?
The same record gives different numbers because each formula decides whether quiet intervals count. Calling out appeared in few intervals here, so most of the 80% interval-by-interval score is agreement that nothing happened. Scored-interval removes those intervals and shows the observers rarely caught the same occurrences.
The effect reverses at high rates. Suppose a behavior is scored in nearly every interval: Observer A leaves only intervals 4 and 7 blank, and Observer B leaves only 4 and 9 blank. Interval-by-interval is again 8 ÷ 10 = 80%, scored-interval is 7 ÷ 9 = 77.8%, and unscored-interval falls to 1 ÷ 3 = 33.3%. A small number of scored or unscored intervals also means one disagreement moves the score a long way, so read a low score as a reason to look at the record.
How does trial-by-trial IOA work?
Trial-by-trial IOA is trials with agreement ÷ total trials × 100, and it fits discrete-trial data where each trial is marked correct or incorrect.
Fictional example. Using separate trial data from the same session, both observers score 10 discrete trials.
| Trial | 1 | 2 | 3 | 4 | 5 | 6 | 7 | 8 | 9 | 10 |
|---|---|---|---|---|---|---|---|---|---|---|
| Observer A | + | + | − | + | + | − | + | + | + | − |
| Observer B | + | + | − | + | − | − | + | + | + | + |
- Agreed: every trial except 5 and 10, which is 8 trials.
- Result: 8 ÷ 10 × 100 = 80%.
Both observers recorded 7 correct trials, so comparing totals would give 7 ÷ 7 = 100%. Reed and Azulay (2011) describe trial-by-trial as being as stringent as exact agreement.
How do you calculate duration IOA?
You calculate total duration IOA as shorter total ÷ longer total × 100, and mean duration-per-occurrence IOA as the mean of shorter ÷ longer for each occurrence.
Fictional example. Using separate timing data from the same session, both observers time three out-of-seat episodes with stopwatches.
| Episode | Observer A | Observer B | Shorter ÷ longer |
|---|---|---|---|
| 1 | 40 s | 50 s | 40 ÷ 50 = 80% |
| 2 | 120 s | 110 s | 110 ÷ 120 = 91.7% |
| 3 | 20 s | 40 s | 20 ÷ 40 = 50% |
| Total | 180 s | 200 s |
- Total duration IOA: 180 ÷ 200 × 100 = 90%.
- Mean duration-per-occurrence IOA: (80 + 91.7 + 50) ÷ 3 = 221.7 ÷ 3 = 73.9%.
In this example, total duration looks better because a long episode can absorb errors on short ones; with other data the two can order either way (see problem 4). Reed and Azulay (2011) call total duration, like total count, a relatively insensitive measure. They also say duration-based algorithms are used when data come from timings such as latencies, durations and inter-response times, so those measures take the same shorter ÷ longer arithmetic. In our reading, one latency pair of 5 seconds and 6 seconds gives 5 ÷ 6 × 100 = 83.3%. See latency vs IRT for those measures.
Which IOA formula should you use?
Use the formula that matches how the data were recorded, then pick the stricter option when the behavior’s rate could flatter the score.
| How the data were recorded | Formula to use |
|---|---|
| Tally of events, session total only | Total count, the only option, and report it as a weak check |
| Tally of events by interval | Mean count-per-interval, or exact count-per-interval for a stricter check |
| Discrete trials | Trial-by-trial |
| Stopwatch timings | Mean duration-per-occurrence if each episode is timed; total duration if only the total is kept |
| Interval or time sampling, mid rate | Interval-by-interval (our reading) |
| Interval or time sampling, low rate | Scored-interval |
| Interval or time sampling, high rate | Unscored-interval |
Reed and Azulay (2011), citing Cooper and colleagues, say scored-interval is most useful at low rates and unscored-interval at high rates. Exam-prep materials put numbers on this (about 30% of intervals or fewer, about 70% or more), but we found no primary source for those cutoffs.
Figure 2 puts all nine formulas on one page, each with a small worked example.
What IOA percentage is acceptable?
The conventional minimum for IOA is 80%, but that figure comes from research standards and convention, and we found it in no BACB document we checked. The What Works Clearinghouse Handbook, version 5.0 (2022), sets minimum values of at least .80 for percentage agreement and at least .60 for Cohen’s kappa in single-case research. Johnston (2025) notes that it is not uncommon for a minimum of 80% to be considered satisfactory but that there is “no universally agreed upon standard.”
The current RBT Test Content Outline, BCBA Test Content Outline and RBT Handbook do not mention IOA or set a figure. Standard 2.17 of the Ethics Code for Behavior Analysts requires appropriate selection and correct implementation of data collection procedures, without naming a percentage.
Always report the formula with the number. Vollmer and colleagues (2008) say there is no “magic” score because some measures are more conservative than others, and they advise being concerned by a low percentage while not taking comfort from a high one. The session above shows why: 80% interval-by-interval and 33.3% scored-interval describe the same two records.
How often should IOA data be collected?
The What Works Clearinghouse Handbook (2022) requires IOA on at least 20% of data points, collected in every phase, for single-case studies that rely on direct observation. No BACB document we checked sets a frequency for clinical work. Vollmer and colleagues (2008) suggest practitioners could run a 10-minute session once a week with each client to monitor reliability and treatment integrity.
Study materials often quote at least 20% of sessions, preferably 25-33%, and credit the Cooper, Heron and Heward textbook. We could not open that text, so treat the range as unconfirmed. Your organization or a funder may set its own rule. In our reading, checks should also be spread across phases, settings and observers so they represent the data you will act on.
What should you do when IOA is low?
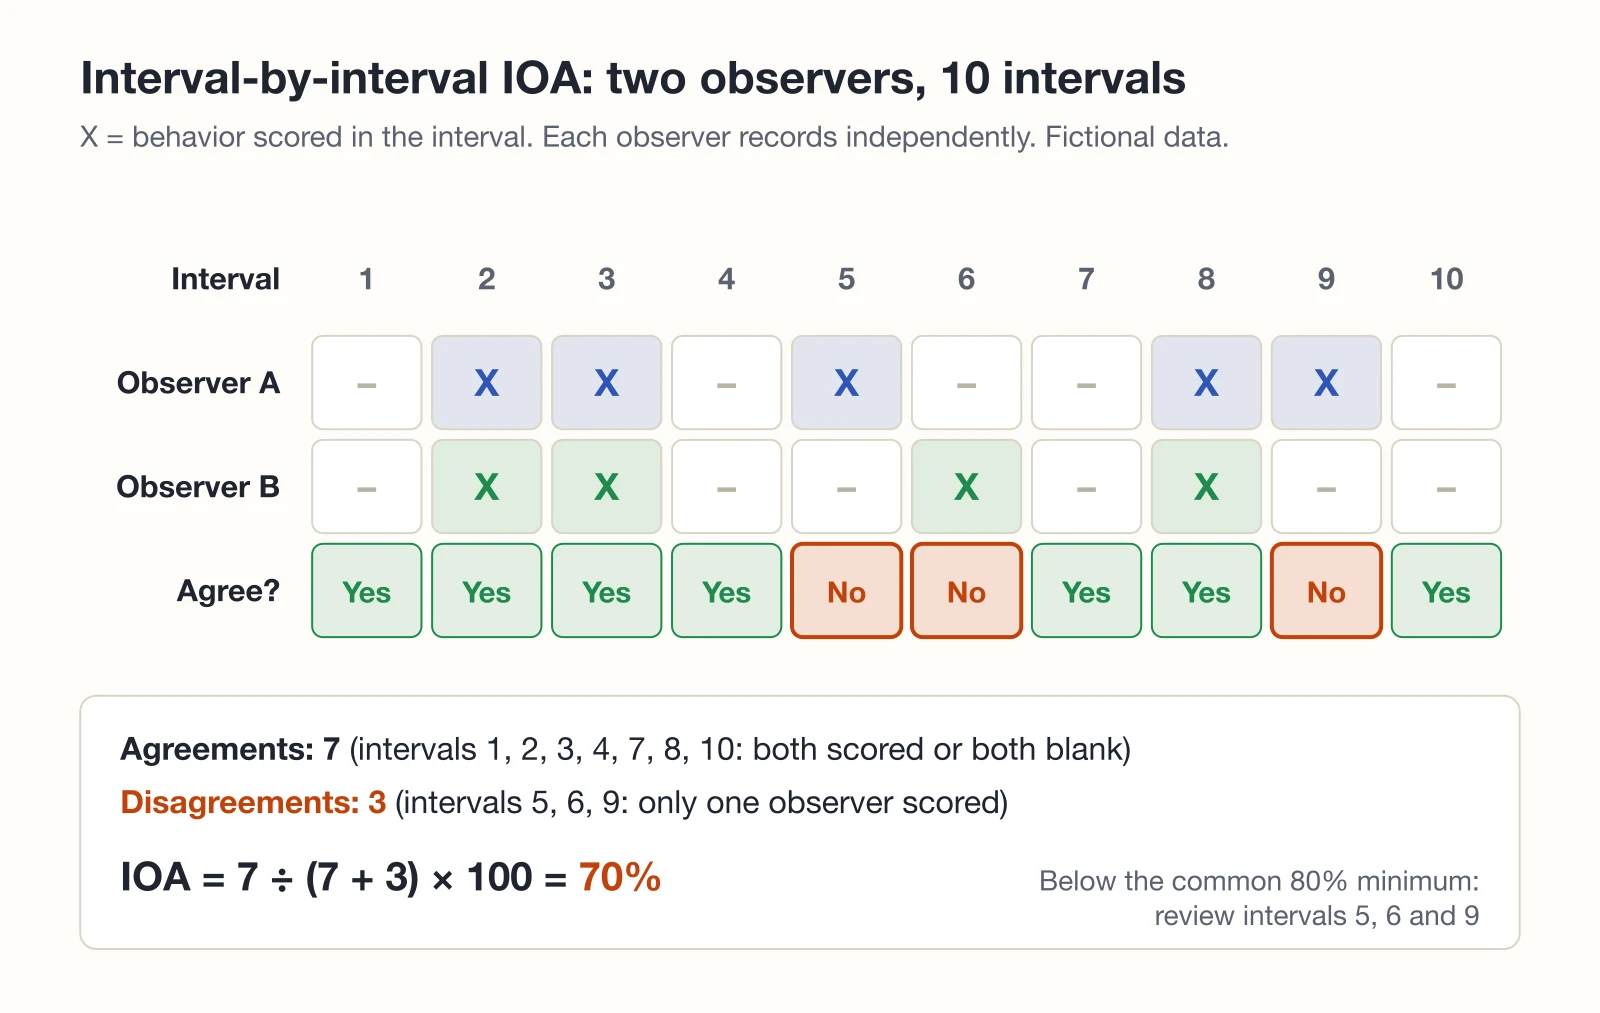
When IOA is low, find out why before anyone relies on those data. A score of 70% is below the common 80% minimum, so the next step is to review the discrepancy, not to average the two records or throw one out. These steps are our recommendation:
Figure 3 shows step 2 on a fictional interval record that scores 70%.
- Report the discrepancy. Tell the supervisor or the person who owns the plan, who is not always the second observer. Task E.2 of the RBT outline names data irregularities as something to take to a supervisor.
- Compare the records line by line. Find the intervals or trials where you differ.
- Discuss the definition. Vollmer and colleagues (2008) advise inviting the observer to review definitions and other sources of error. A vague operational definition is one possible cause.
- Check the setup. Confirm that both observers had the same view, the same timer and the same interval marks.
- Practice and recheck. Score a sample together, then collect IOA independently again.
For supervisors, see the IOA documentation mistakes that hide these problems. When scoring keeps slipping over time, use the steps in how to detect observer drift with IOA.
What does an RBT do when asked to collect IOA?
An RBT who is asked to collect IOA scores the same session independently, using the same behavior definition and measurement system as the other observer, and does not compare sheets until both are finished. Then the RBT reports any differences to the supervisor. In an IOA session you are usually one of the two observers, so follow the definition exactly and record only what you see. The data sheet and the write-up are in how RBTs collect and record IOA. The BCBA role adds choosing the formula and deciding what the result means.
IOA for RBTs and BCBAs: what do the exams cover?
Neither exam outline names IOA or a specific formula, so what follows on study scope is our reading of the tasks.
| Exam | Closest tasks | What to study (our reading) |
|---|---|---|
| RBT (3rd ed., from 2026) | A.8 “Describe the risks associated with unreliable data collection and poor procedural fidelity”; A.6 “Calculate and summarize data in different ways” | What IOA is and why it matters, what high and low scores mean, and how to calculate a basic percentage such as total count |
| BCBA (6th ed., from 2025) | C.8 “Evaluate the validity and reliability of measurement procedures” | All nine formulas, which fits which data, and how each can overstate or understate agreement |
What are the common IOA mistakes?
- Reporting the percentage without naming the formula.
- Putting the larger count on top instead of the smaller.
- Scoring an interval where both observers recorded zero as a miss in the count formulas, when it is full agreement.
- Choosing interval-by-interval for a low-rate behavior, where quiet intervals inflate the score.
- Choosing the formula after seeing which one gives the best number.
IOA practice problems: can you score these?
All six are original and fictional. Work each one before opening the answer.
1. Total count
An RBT tallies 18 requests and the supervisor tallies 20 in the same session. What is total count IOA?
Answer
90%. 18 ÷ 20 × 100 = 90%. Smaller count goes on top, whichever observer recorded it.
2. Interval-by-interval and scored-interval
In 20 intervals, Observer A scores intervals 4, 9 and 15. Observer B scores intervals 4, 9 and 12. What are interval-by-interval and scored-interval IOA?
Answer
90% and 50%. They disagree on intervals 12 and 15, so interval-by-interval is 18 ÷ 20 × 100 = 90%. At least one scored intervals 4, 9, 12 and 15, and both scored 4 and 9, so scored-interval is 2 ÷ 4 × 100 = 50%.
3. Trial-by-trial
Two observers score 20 discrete trials and agree on 17. What is trial-by-trial IOA?
Answer
85%. 17 ÷ 20 × 100 = 85%.
4. Duration
Observer A times two episodes at 30 s and 60 s. Observer B times them at 30 s and 40 s. What are total duration and mean duration-per-occurrence IOA?
Answer
77.8% and 83.3%. Totals are 90 s and 70 s, so 70 ÷ 90 × 100 = 77.8%. Per episode, 30 ÷ 30 = 100% and 40 ÷ 60 = 66.7%, so (100 + 66.7) ÷ 2 = 83.3%.
5. Choosing a formula
A behavior is scored in about 85% of intervals. Which formula gives the stricter check?
- A. Scored-interval
- B. Unscored-interval
- C. Total count
- D. Total duration
Answer
B. At high rates, most agreement comes from intervals both observers scored, so unscored-interval looks at the intervals where they could really differ. Scored-interval is the low-rate choice, and the other two don’t use interval data.
6. A low score
A supervisor and a technician collect IOA, and it comes out at 70%. What should happen next?
- A. Average the two records and graph the result
- B. Discard the technician’s data
- C. Review the differences and clarify the definition
- D. Retrain the technician on reinforcement
Answer
C. A low score is a measurement question, so start with where the records differ and how the behavior is defined. Averaging hides the problem, discarding assumes the technician was wrong, and reinforcement is not what IOA measures.
For more, RBT candidates can go to the Praxis Learn lesson on unreliable data and procedural fidelity, the lesson on calculating and summarizing data and the data collection and graphing practice set. BCBA candidates can use the lesson on validity and reliability and the measurement practice set.
Sources
- Reed, D. D., & Azulay, R. L. (2011). A Microsoft Excel 2010 based tool for calculating interobserver agreement. Behavior Analysis in Practice, 4(2), 45-52.
- Vollmer, T. R., Sloman, K. N., & St. Peter Pipkin, C. (2008). Practical implications of data reliability and treatment integrity monitoring. Behavior Analysis in Practice, 1(2), 4-11.
- Mudford, O. C., Martin, N. T., Hui, J. K. Y., & Taylor, S. A. (2009). Assessing observer accuracy in continuous recording of rate and duration: Three algorithms compared. Journal of Applied Behavior Analysis, 42(3), 527-539.
- Johnston, J. M. (2025). Behavioral measurement as centerpiece. Perspectives on Behavior Science, 48(1), 13-22.
- What Works Clearinghouse. (2022). Procedures and standards handbook, version 5.0. U.S. Department of Education.
- Behavior Analyst Certification Board. RBT Test Content Outline (3rd ed.) (updated 09/2024), BCBA Test Content Outline (6th ed.) (updated 09/2024), RBT Handbook (October 2026 file) and Ethics Code for Behavior Analysts.
Reviewed by the Praxis Notes team on 2026-11-04.